Profiling in Go
pprof allows us to profile cpu and memory of go programs.
Profiling an executable
Install the profile package:
go get github.com/pkg/profile
Add profiling to the start of your main routine:
import "github.com/pkg/profile"
//...
func main() {
  defer profile.Start().Stop()
  //... do stuff
}
Build and run your program; you should see something like:
2020/12/26 16:30:01 profile: cpu profiling enabled,
/var/folders/{temp}/cpu.pprof
...
2020/12/26 16:30:15 profile: cpu profiling disabled,
/var/folders/{temp}/cpu.pprof
We can now use the pprof tool to get insights on our binary:
go tool pprof -top ./my_binary /var/folders/{temp}/cpu.pprof
File: profile
Type: cpu
Time: Dec 26, 2020 at 4:32pm (NZDT)
Duration: 13.26s, Total samples = 2.77s (20.89%)
Showing nodes accounting for 2.68s, 96.75% of 2.77s total
Dropped 16 nodes (cum <= 0.01s)
      flat  flat%   sum%        cum   cum%
     0.90s 32.49% 32.49%      0.91s 32.85%  runtime.nanotime1
     0.54s 19.49% 51.99%      0.54s 19.49%  runtime.pthread...
     0.46s 16.61% 68.59%      0.46s 16.61%  runtime.kevent
     0.36s 13.00% 81.59%      0.36s 13.00%  runtime.usleep
     0.17s  6.14% 87.73%      0.17s  6.14%  runtime.pthread...
     0.09s  3.25% 90.97%      0.09s  3.25%  runtime.pthread...
     0.04s  1.44% 92.42%      0.51s 18.41%  runtime.netpoll
     0.04s  1.44% 93.86%      0.04s  1.44%  runtime.write1
     0.02s  0.72% 94.58%      0.02s  0.72%  runtime.lock2
     0.02s  0.72% 95.31%      0.02s  0.72%  runtime.runqempty
     ...
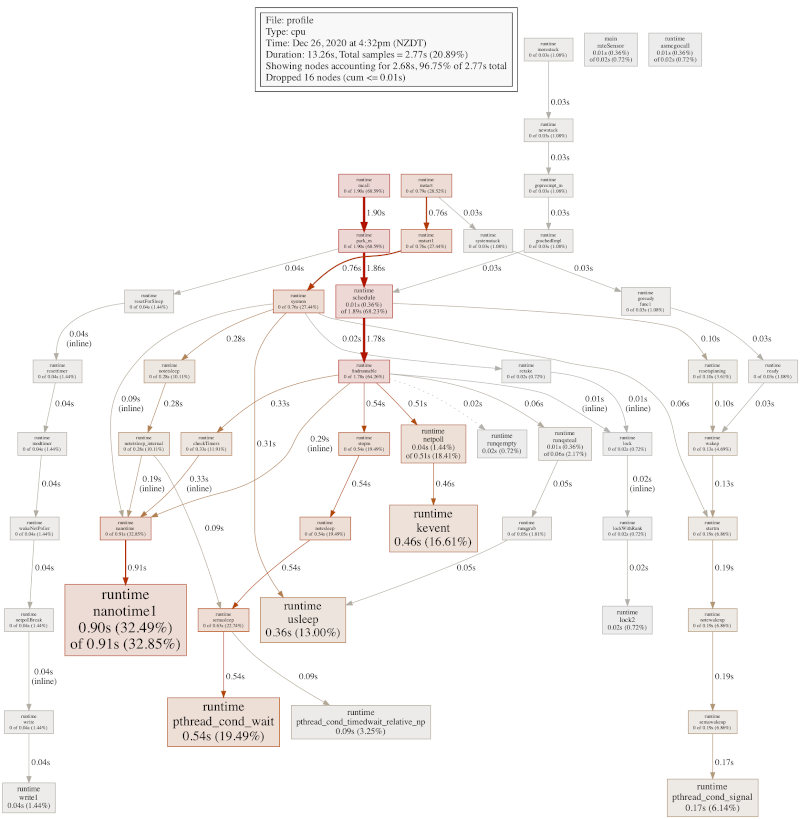
If graphvis is installed, there are a bunch of graphical output options:
go tool pprof -png ./my_binary /var/folders/{temp}/cpu.pprof

These graphs show the callstack of all significant go routines. In this case, there are 5 go routines included.
Options for profile
The github.com/pkg/profile package profiles cpu usage by default. The following two calls are equivalent:
defer profile.Start().Stop()
defer profile.Start(profile.CPUProfile).Stop()
Memory profiling is invoked with:
defer profile.Start(profile.MemProfile).Stop()
A NoShutdownHook should be considered with any non-trivial program. Without this flag, the program will use SIGINT to ensure profiles are written cleanly.
To set the path of the profile (so it stops putting profiles in an akward temp directory):
defer profile.Start(profile.ProfilePath("./profileData")
            ).Stop()
We can combine profile args such as:
defer profile.Start(
  profile.MemProfile,
  profile.ProfilePath("./profileData")
  ).Stop()
For more details, read the pkg/profile docs
