
GDB Cheatsheet
Text User interface
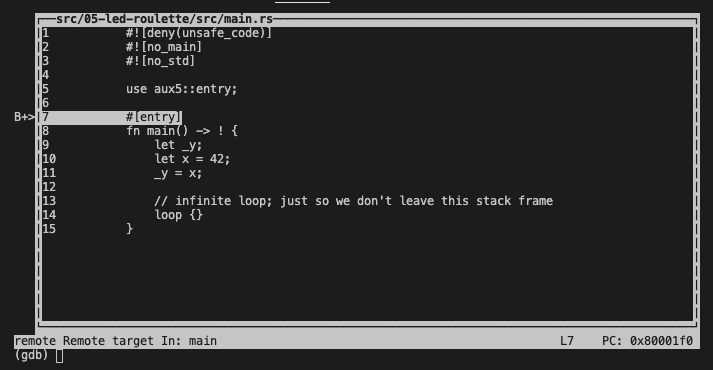
For a more interactive gdb session, can use a text user interface:
(gdb) layout src
(gdb) layout asm
(gdb) layout split
Depending on which command was run, it will display the source, assembler or both.
To remove the text user interface (tui):
(gdb) tui disable
Commands
Stepping through code is done with the step command. Optionally a number of steps <N> can be specified. Entering a blank command after a step will continue stepping the code.
To only step 1 assembly instruction at a time, use stepi.
(gdb) step
(gdb) step <N>
(gdb) s
(gdb) stepi
(gdb) si
To step over (rather than into):
(gdb) next
(gdb) n
To step out of the current function:
(gdb) finish
Use continue to run to the next breakpoint.
(gdb) continue
(gdb) c
Use break to set a breakpoint at entry to <function>.
(gdb) break <function>
(gdb) b <function>
Set a breakpoint at a particular file on a particular line.
(gdb) break <file>:<ln>
(gdb) break main.rs:14
To disable and enable breakpoints, use the breakpoint numbers:
(gdb) disable 1
(gdb) enable 1
A value of a local variable can be printed with print. Expressions can also be evaluated
(gdb) print <a>
(gdb) p <a>
(gdb) print <a + b>
To show the value of all local variables:
(gdb) info locals
(gdb) i locals
To show function args:
(gdb) info args
To set the value of a local:
(gdb) set <variable> = <value>
Reset the session:
(gdb) monitor reset halt
Show the current backtrace:
(gdb) backtrace
Ending a session
(gdb) quit
Remote debugging
(gdb) target remote <ipaddr>:<port>